Once again I’ve compiled some charts to show what the major, full desktop distributions look like while running on limited hardware. Just like before I’ve decided to re-run my previous tests this time using the following distributions:
- Fedora 17 (GNOME)
- Fedora 17 (KDE)
- Kubuntu 12.04 (KDE)
- Linux Mint 13 (Cinnamon)
- Linux Mint 13 (KDE)
- Linux Mint 13 (Mate)
- Linux Mint 13 (Xfce)
- Mageia (GNOME)
- Mageia (KDE)
- OpenSUSE 12.2 (GNOME)
- OpenSUSE 12.2 (KDE)
- Ubuntu 12.04 (Unity)
- Xubuntu 12.04 (Xfce)
I will be testing all of this within VirtualBox on ‘machines’ with the following specifications:
- Total RAM: 512MB
- Hard drive: 8GB
- CPU type: x86 with PAE/NX
- Graphics: 3D Acceleration enabled
The tests were all done using VirtualBox 4.1.22, and I did not install VirtualBox tools (although some distributions may have shipped with them). I also left the screen resolution at the default (whatever the distribution chose) and accepted the installation defaults. All tests were run between September 3rd, 2012 and September 14th, 2012 so your results may not be identical.
Results
Following in the tradition of my previous posts I have once again gone through the effort to bring you nothing but the most state of the art in picture graphs for your enjoyment.
Things to know before looking at the graphs
First off if your distribution of choice didn’t appear in the list above its probably not reasonably possible to installed (i.e. I don’t have hours to compile Gentoo) or I didn’t feel it was mainstream enough (pretty much anything with LXDE). Secondly there may be some distributions that don’t appear on all of the graphs, for example Mandriva (now replaced by Mageia). Finally I did not include Debian this time around because it is still at the same version as last time. As always feel free to run your own tests.
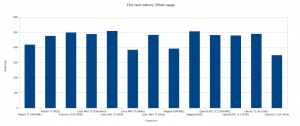
First boot memory (RAM) usage
This test was measured on the first startup after finishing a fresh install.
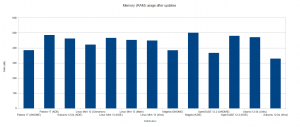
Memory (RAM) usage after updates
This test was performed after all updates were installed and a reboot was performed.
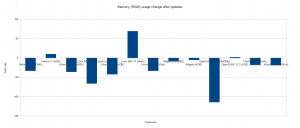
Memory (RAM) usage change after updates
The net growth or decline in RAM usage after applying all of the updates.
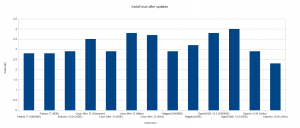
Install size after updates
The hard drive space used by the distribution after applying all of the updates.
Conclusion
As before I’m going to leave you to drawing your own conclusions.


this is just… useless!
I don’t understand because in few release all distro becomes so extremely ram-eaters.
M$ reduced ram usage with Vista>7>8… Linux distro do the opposite. 🙁