It’s been a while but once again here is the latest instalment of the series of posts where I install the major, full desktop, distributions into a limited hardware machine and report on how they perform. Once again, and like before, I’ve decided to re-run my previous tests this time using the following distributions:
- Debian 8 (Cinnamon)
- Debian 8 (GNOME)
- Debian 8 (KDE)
- Debian 8 (MATE)
- Debian 8 (Xfce)
- Elementary OS 0.3 (Freya)
- Kubuntu 15.04 (KDE)
- Linux Mint 17.1 (Cinnamon)
- Linux Mint 17.1 (KDE)
- Linux Mint 17.1 (MATE)
- Linux Mint 17.1 (Xfce)
- Mageia 4.1 (GNOME)
- Mageia 4.1 (KDE)
- OpenSUSE 13.2 (GNOME)
- OpenSUSE 13.2 (KDE)
- Ubuntu 15.04 (Unity)
- Ubuntu Mate (MATE)
- Xubuntu 15.04 (Xfce)
I also attempted to try and install Fedora 21 and Linux Mint 17.2 (KDE) but it just wouldn’t go.
All of the tests were done within VirtualBox on ‘machines’ with the following specifications:
- Total RAM: 512MB
- Hard drive: 8GB
- CPU type: x86 with PAE/NX
- Graphics: 3D Acceleration enabled
The tests were all done using VirtualBox 4.3.30, and I did not install VirtualBox tools (although some distributions may have shipped with them). I also left the screen resolution at the default (whatever the distribution chose) and accepted the installation defaults. All tests were run prior to June 2015 so your results may not be identical.
Results
Just as before I have compiled a series of bar graphs to show you how each installation stacks up against one another. Measurements were taken using the free -m command for memory and the df -h command for disk usage.
Like before I have provided the results file as a download so you can see exactly what the numbers were or create your own custom comparisons (see below for link).
Things to know before looking at the graphs
First off if your distribution of choice didn’t appear in the list above its probably not reasonably possible to be installed (i.e. I don’t have hours to compile Gentoo) or I didn’t feel it was mainstream enough (pretty much anything with LXDE). As always feel free to run your own tests and link them in the comments for everyone to see.
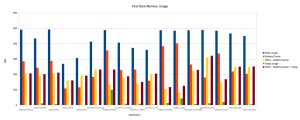
First boot memory (RAM) usage
This test was measured on the first startup after finishing a fresh install.
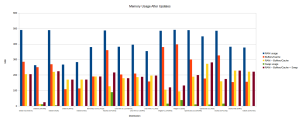
 Memory (RAM) usage after updates
This test was performed after all updates were installed and a reboot was performed.
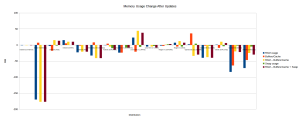
 Memory (RAM) usage change after updates
The net growth or decline in RAM usage after applying all of the updates.
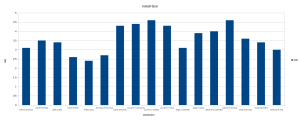
The hard drive space used by the distribution after applying all of the updates.
Once again I will leave the conclusions to you. Source data provided below.
Source Data


Could you also test Lubuntu as well as it is meant to be a small footprint Ubuntu.
@D S
So while you are correct that Lubuntu is supposed to run better on lower end hardware the point of these articles is to see how full, “big,” distributions run when squeezed down to fit on older hardware. I have no doubt that Lubuntu would run better than most of these 🙂